
The Customer Effort Score (CES) quickly became a popular metric for Customer Experience (CX) programs after its launch in 2010–and for good reason.
CEB Global, the firm that created the CES methodology, reports that 96% of customers reporting high-effort experiences became more disloyal in the future, compared with only 9% of those with low-effort experiences.
CES has continued its rise in the CX field recently, and the metric is now widely used to complement or replace the other key CX metrics – Net Promoter Score (NPS)* and Overall Satisfaction (CSAT). For a more detailed review and comparison of these 3 CX metrics, check out our blog post “Your Guide to 3 Proven CX Metrics”.
Since CES is relatively new to the CX landscape, its application within CX practices is still evolving. In fact, while researching this post, we found a wide range of CES approaches among corporations, CX consulting companies, and software providers. With that in mind, this post addresses several common questions CX practitioners ask, including:
- What is CES 2.0?
- How does CES compare to NPS?
- Can we use CES and NPS together in transactional CX surveys?
- How do we CES? And what is a “good” Customer Effort Score for my company?
What Is CES 2.0?
When CES launched in 2010 the methodology consisted of the question “How much effort did you personally have to put forth to handle your request?”- with a 5-point scale from very low effort (1) to very high effort (5)
In 2013, citing goals to reduce inconsistent interpretation, while enhancing global application and benchmarking, CEB Global announced CES 2.0. CES 2.0 includes a simpler customer effort question and a 7-point agreement/disagreement scale:
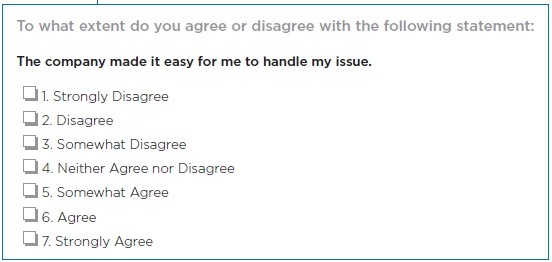
Image Source: CEB Global
How Does CES Compare to NPS?
CEB Global touts CES as a “predictor of loyalty”, while the Net Promoter group markets NPS as a “predictor of growth”. While growth and loyalty are closely related concepts, the logic and research behind NPS and CES are fundamentally different.
Although companies often use NPS in transactional survey programs, its original intent was to measure a customer’s overall perception of a brand. These perceptions are based on and influenced by a number of factors, including product and service type, a customer’s “time” with the brand, service and support, pricing, and many others.
CES, in contrast, is based on research that indicates that delighting customers doesn’t build loyalty, but reducing customer effort—the work they must do to get their problem solved—does.
Put another way, service interactions don’t build (much) loyalty even when done well. Research suggests that every support interaction is much more likely to create disloyalty with a brand. In fact, research by CEB suggests that service calls are 4x as likely to decrease loyalty as increase it.
So what’s the key takeaway? Both metrics offer value to CX programs, but in different ways. NPS is a broader relationship metric that offers insights on a customer’s perception of a brand across a number of factors, while CES provides focused feedback on a customer’s feelings about the ease of handling service transactions with their providers.
Can We Use CES and NPS Together in Transactional CX Surveys?
At eTouchPoint, we generally recommend that clients include NPS and CES questions in their transactional surveys. As noted above, NPS helps monitor and gauge customer perceptions across a range of factors, while CES highlights a company’s effectiveness in supporting customers and provides targeted feedback that can be used to identify service barriers, reduce service costs, and improve overall service.
This approach is consistent with insight from CEB Global in a blog post discussing whether the two methodologies are mutually exclusive:
“They answer different questions, which gives service leaders a holistic picture of the customer experience and its impact….in a nutshell, NPS answers questions from the business perspective, and CES answers from the service perspective.”
How Do We Calculate CES? And What Is a “Good” Customer Effort Score for My Company?
While researching customer effort scores and benchmarking data for this post, we were surprised by the lack of uniformity in how CES is calculated. Also, we found little to no available CES benchmarking data.
Our research found a variety of “CES” flavors that used different scale terminologies, scale sizes (typically five or seven point scales), and formulas for calculating CES. From our review, though, the three most prevalent calculations used are:
- An average Customer Effort Score: The sum of 1-7 responses/total # of responses
- “Net Easy Score”: Made popular by British Telecom, this calculation uses a three point easy to difficult scale and mimics the NPS calculation by subtracting the % of strongly disagree/difficult from the % of strongly agree/easy.
- CES 2.0 Metric from CEB Global: CEB Global’s recommended formula is the % of customers at least somewhat agreeing (scores of 5-7) that the company made it easy to resolve their issue.
In a post announcing CES 2.0, CEB addressed CES scoring by recommending that companies:
“focus on moving customers to at least a ‘5’ on the 7-point CES 2.0 scale…. Moving a customer from a ‘1’ to a ‘5’ boosts their loyalty by 22%, but there are diminishing returns after that – moving a customer from a ‘5’ to a ‘7’ only boosts their loyalty by 2%.
And the payoffs of doing so – well, they are pretty huge. Moving from the bottom performing quartile companies on CES 2.0 to the top quartile improves NPS by 65 points and ups repurchase intent by 40%.”
The Customer Effort Score is One Element of a Well-Rounded Feedback Approach
We recommend CES to our clients based on the research behind the methodology and the fact that it passes our internal litmus test for inclusion on CX surveys. Our experience has taught us that customers are emotional about resolving issues easily–and CES feedback is actionable for companies, particularly when paired with open-ended verbatim feedback.
That said, we believe it is only one of many tools CX programs need. For the best results, we recommend pairing CES with multi-channel feedback gathering, closed loop alerting, and verbatim analysis to craft a complete view of the customer journey for service providers.
__________________
*NPS is trademarked by Bain and Company, Fred Reichheld, and Satmetrix Systems.
Author: Chip James
Chip James is President of eTouchPoint, a pioneering customer experience (CX) technology provider that has provided solutions to Fortune 500 leaders for 15+ years. A CX industry veteran, Chip has been a leading CX advocate through speaking engagements and development of industry best practices. Prior to his work at eTouchPoint, Chip held leadership roles at Commercetel, Qualistics, and CGI. He completed his undergraduate degree at the University of Virginia and holds an MBA from Georgia State University.